The study
An online survey was used to collect the data (http://www.shaikh.us/fontstudy/). Participants were provided with a consent form online. The survey took approximately 40 minutes to complete and consisted of a demographic questionnaire followed by two parts. Part A asked participants to rate 20 font samples using 15 personality adjective pairs based on a 4-point Likert scale. In Part B participants viewed 20 font samples and indicated whether they would use the font for 25 different digital uses.
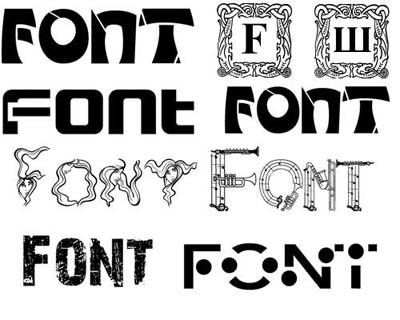
The 20 fonts used throughout the online survey are shown in Figure 1.

In Part A, the participants saw a randomized sample of text (provided as an image) that included the alphabet, numerals, and common symbols rendered in 14-point as shown in Figure 2. The 15 personality adjective pairs used in Part A are shown in Figure 3. Personality research, adjective lists, and pilot testing were used to determine the final 15 adjective pairs used in the survey.

Figure 2. Sample of the text seen in Part A to assess personality traits associated with the fonts. This sample shows the font Consolas.

Figure 3. Fifteen adjective pairs were used to assess perceived personality of fonts. The scores were based on a 4-point Likert scale as shown.
Images showing one of three pangrams and the digits 0-9 were used in Part B to assess perceived uses of the fonts. The following pangrams were used (1) The quick brown fox jumped over the lazy dog. (2) Amazingly few discotheques provide jukeboxes. (3) Whenever the black fox jumped the squirrel gazed suspiciously. Display of the pangrams was randomized. The pangrams and digits were shown in both 12-point and 24-point for each font as shown in Figure 4. In Part B, the participants were asked to indicate whether they would use a font or not by clicking a checkbox (yes) or leaving it unchecked (no). Table 1 provides the 25 uses assessed in Part Three. Participants were allowed to choose as many or as few uses as they felt were appropriate; participants could also choose the option, "I would not use this font for any purpose."

Figure 4. Sample of pangrams and digits used in Part B to assess perceived uses of fonts. This sample shows the font Corbel.
Table 1. 25 uses were evaluated for each font.

The Results

No comments:
Post a Comment